








































In this article
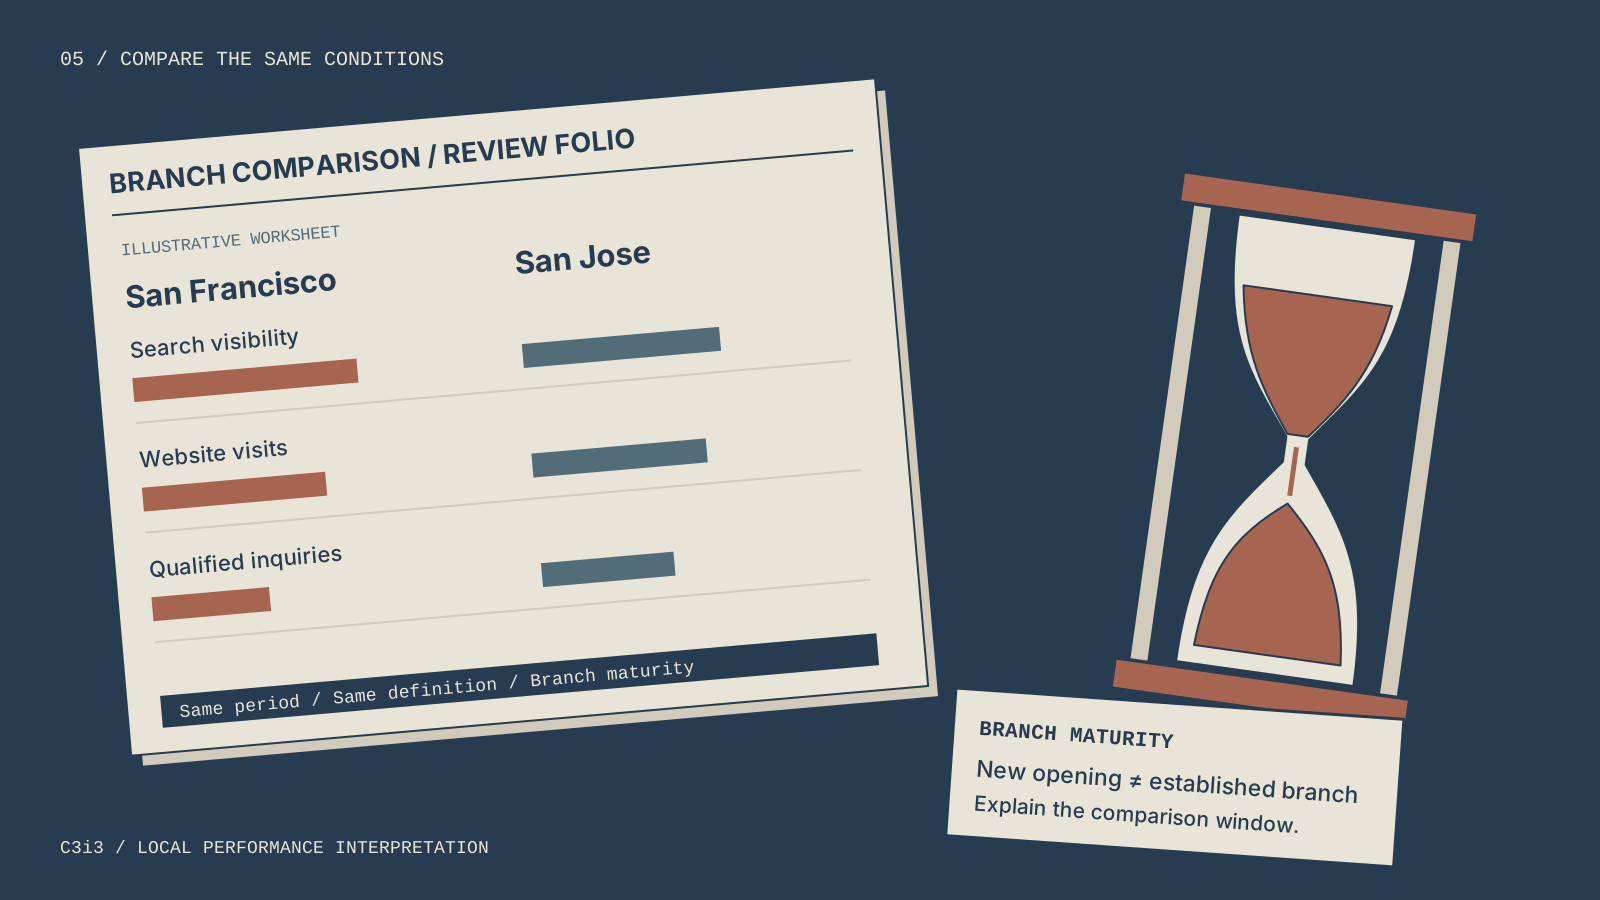
A branch report can look precise while comparing different things. The San Francisco location may have operated for the whole period, while the San Jose location opened midway through it. One branch may receive demonstration appointments and the other equipment intake inquiries. A table that ranks them by one combined total hides those differences.
Local SEO reporting across branches should help a business decide what to investigate or improve. It should not turn every difference into a judgment about the local team. This guide explains how to create comparable records, separate evidence from assumptions and interpret the customer journey without overstating attribution. It builds on the multi-location local SEO framework, which connects the real branches with their pages, profiles and inquiry routes.
What decision should a branch report help you make?
Choose the business decision before selecting metrics. A report might help identify a disconnected branch destination, an unclear service explanation or an inquiry route that needs checking. Each decision requires different evidence.
Start with the intended customer action at each location. A branch offering product demonstrations may need suitable appointment inquiries. A service intake location may need customers to describe equipment and the requested work. Combining both actions into “leads” can make the report less useful even when every count is technically correct.
How do you define a qualified branch inquiry?
Write a business definition that a reviewer can apply consistently. It might require a relevant service need, a location the business can support and enough information for a meaningful next step. The exact definition belongs to the business; a generic analytics label cannot establish it.
Record which branch the request concerns and whether it reached the appropriate destination. A visitor can begin on a San Francisco page and ask about San Jose availability. The landing page alone does not prove the requested branch.
The existing SEO agency accountability guide explains a broader provider review. This article has a narrower task: comparing branches fairly while preserving their operating context and the limits of the evidence.
Which evidence layers should remain separate in local SEO reporting?
Separate discovery, profile interactions, website behavior and qualified business inquiries. They describe different stages and units. Do not add their totals together as though they were distinct people completing the same action.
Search Console provides website search observations such as impressions and clicks. Business Profile performance describes supported interactions with a public profile. Website analytics records observed activity on the site. An inquiry record can show whether a meaningful request was suitable and reached the correct branch.
What does each platform actually establish?
Google’s Search Console performance reference defines its search metrics. Its Business Profile performance documentation defines profile interactions, including call-button clicks. A click does not establish that a call was answered. The profile report can also include activity from Google Ads, so do not label the whole export organic SEO without checking its scope.
Google Analytics events describe implemented observations on the website. Google’s events documentation distinguishes event types. Before using an event as an inquiry count, verify what triggers it. Opening a form, clicking a contact link and receiving a completed submission are different events.
Keep an evidence note beside each metric: source, unit, date range, branch mapping and known limitation. A smaller report with understandable measures is easier to act on than a dashboard whose labels imply more certainty than the systems provide.
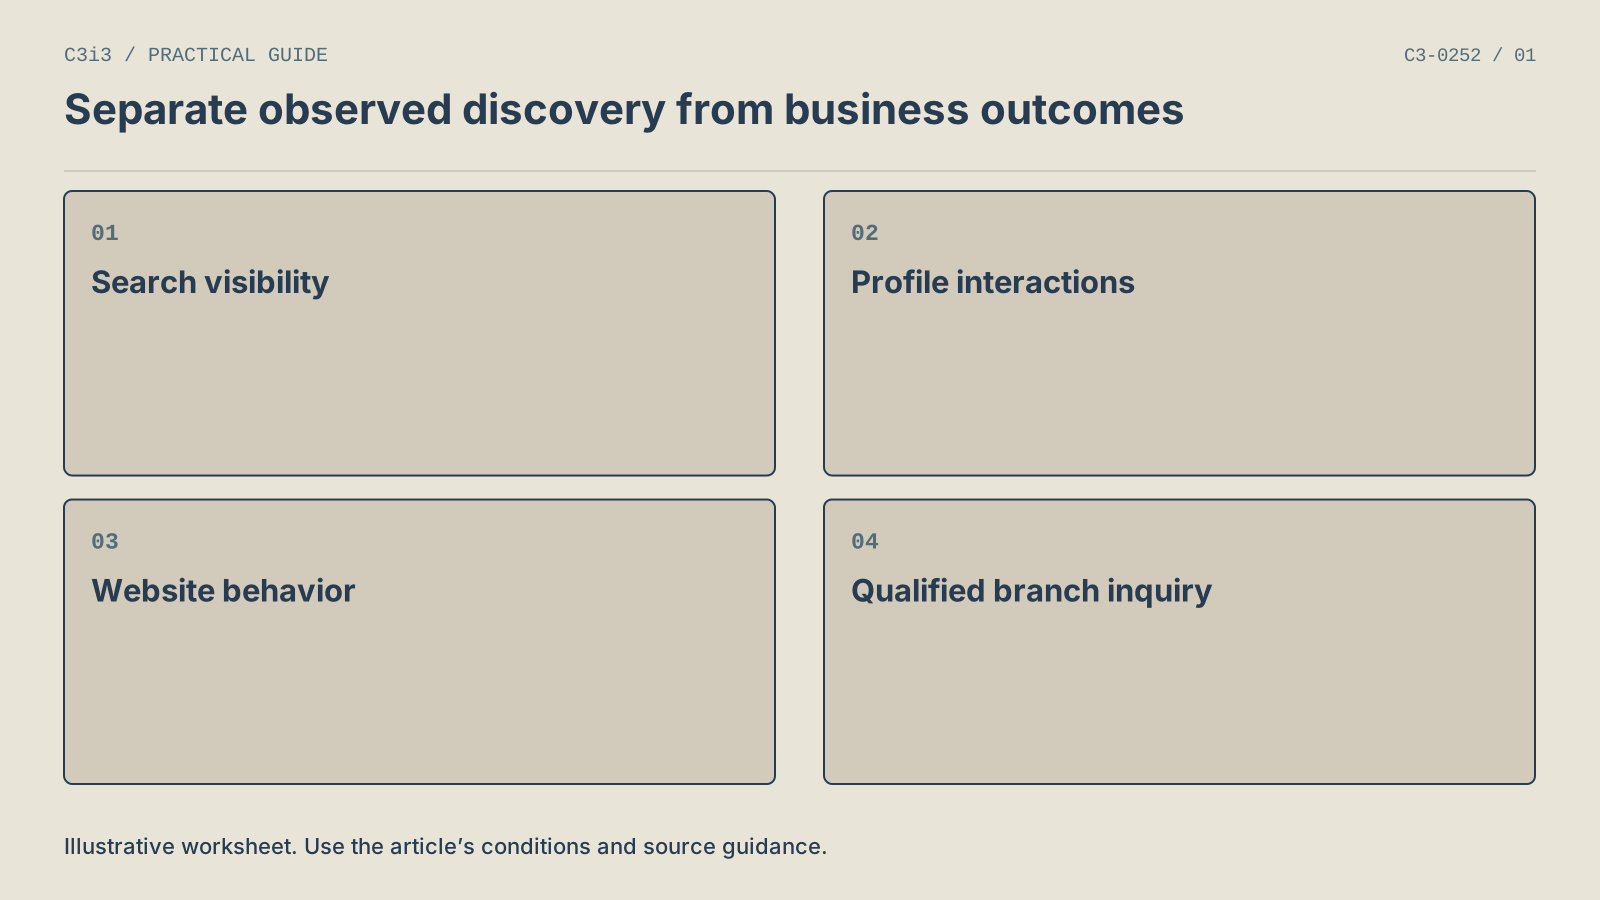
Search visibility describes discovery. Profile interactions describe supported platform actions. Website analytics records observed site behavior. The inquiry record establishes qualification and destination. Do not add these counts into a single lead total.
How do you make San Francisco and San Jose branches comparable?
Match the operating period, intended action and relevant service where possible. Record important differences that cannot be matched. A comparison can still be useful when branches differ, provided the report states what the difference prevents you from concluding.
Use a common date window in the reporting systems and the business inquiry record. Then check whether each branch was operational throughout that window. If a branch opened later, compare the shared operating period or present its partial period separately.
Which contextual notes belong beside the numbers?
Record new services, temporary interruptions, campaign activity and changes to the page or inquiry process. Note whether a location serves a different buyer type. These observations do not automatically explain a result, but they identify plausible questions for investigation.
An illustrative demonstration location may have fewer inquiries than an intake branch while still receiving suitable requests for its purpose. Compare the quality and completion of the intended action before deciding that the smaller count represents a weaker journey.
The same principle applies to geography. A query containing “San Francisco” does not establish that the searcher was physically in San Francisco. Likewise, the visitor’s apparent location does not establish the branch they intended to contact. Keep geographic query labels, visitor context and actual branch selection distinct.
If you cannot form a comparable group, report the branches individually and explain why. Forcing unlike operations into a league table can obscure the exact problem the report is supposed to reveal.
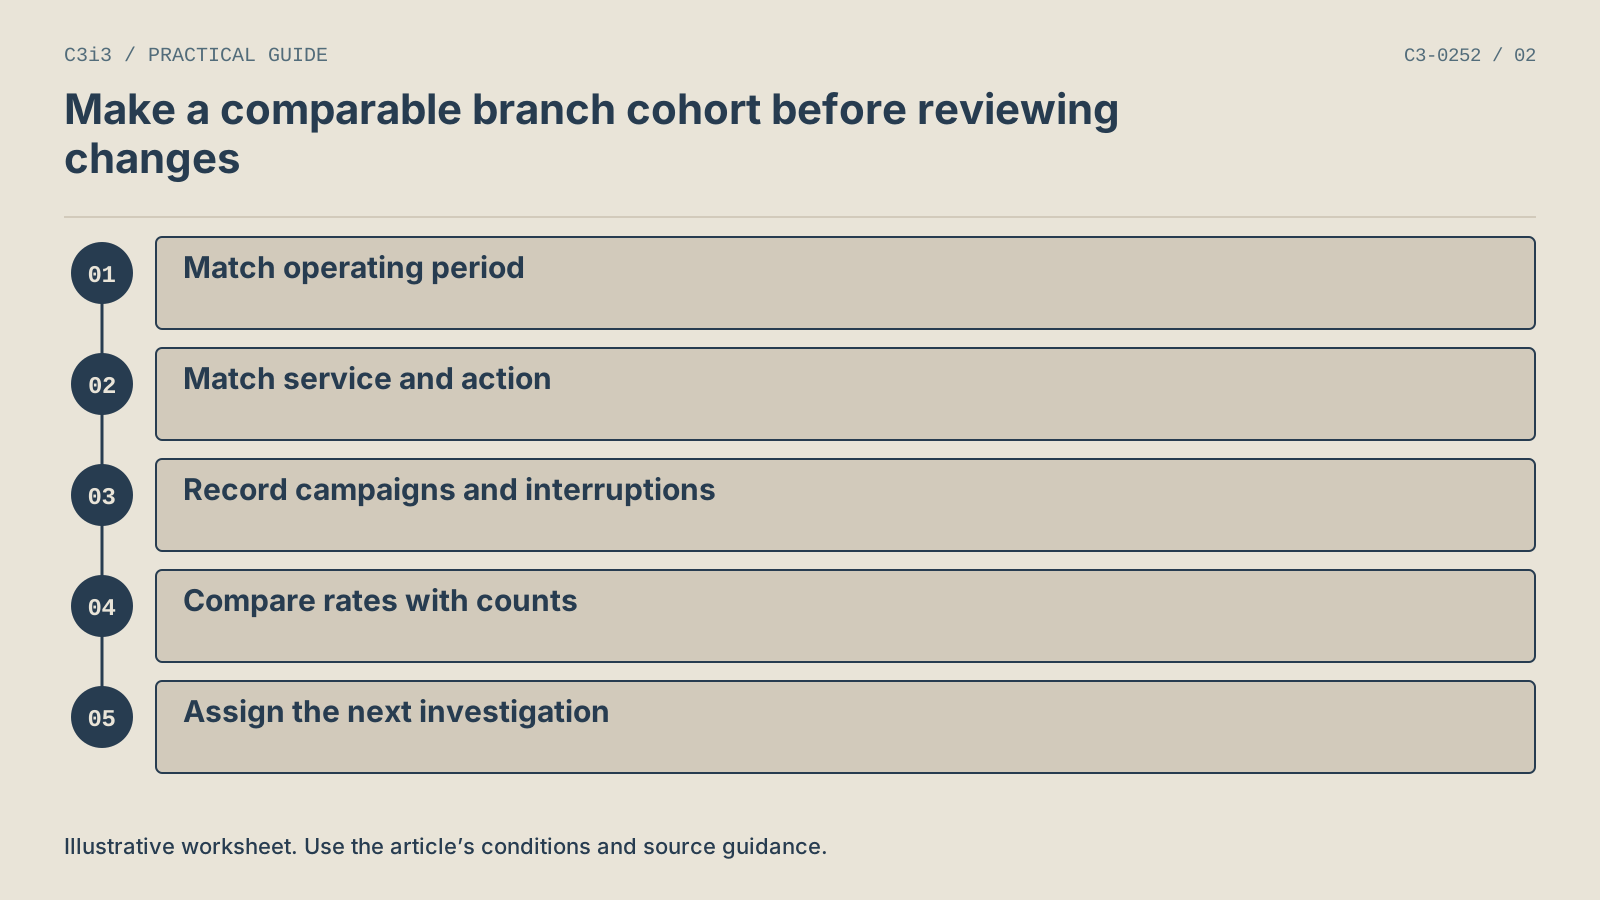
Match the branches’ operating period and intended customer action, record campaigns and interruptions, compare rates alongside their counts and assign a specific next investigation.
How should counts and rates be interpreted together?
Show the underlying counts, define the denominator and calculate a rate only when its relationship to the numerator is meaningful. A percentage without its sample size or source can exaggerate the importance of a small difference.
Consider this hypothetical website-only comparison. Assume both branches operated throughout the same period, the measured sessions belong to the defined branch journey and the qualified inquiries can be linked to those sessions. The numbers below are illustrative and are not C3i3 client results.
| Illustrative branch | Observed sessions | Linked qualified inquiries |
|---|---|---|
| San Francisco | 180 | 9 |
| San Jose | 100 | 8 |
The illustrative rates are 9 divided by 180, or 5%, and 8 divided by 100, or 8%. San Francisco has the larger inquiry count, while San Jose has the higher calculated rate. Neither observation proves that one branch’s SEO is superior. The service mix, traffic sources and small inquiry counts still require review.
What should you do when the numerator and denominator cannot be connected?
Report them separately. For example, do not divide all branch phone inquiries by website sessions if those calls include sources outside the measured website journey. That calculation could look like a conversion rate while describing unrelated populations.
Use rates as prompts for investigation, not explanations by themselves. A useful next question is whether a landing page attracts the intended buyers or whether the inquiry route preserves the selected branch. A percentage does not answer those questions without supporting evidence.
How do you connect branch pages, traffic sources and inquiry records?
Use the same stable branch identifier across the reporting plan, then preserve the meaning of each source. The identifier connects records operationally. It does not make different systems observe the same customer journey or fill gaps in attribution automatically.
For website analysis, define which canonical pages belong to each branch and which are shared. Keep product and service pages with no clear branch relationship in a separate group until the intended action establishes a location. Check redirects and shared booking destinations so an old URL does not split the reporting unexpectedly.
Which analytics scope should you use for acquisition questions?
Use dimensions appropriate to the question and keep them consistent. Google’s Traffic acquisition documentation explains session-scoped acquisition reporting. Do not mix a first-user acquisition dimension with a session-based interpretation without accounting for the difference.
If the business uses tagged external campaign destinations, record the naming convention and its purpose. Keep ordinary internal editorial links clean. The reporting plan should help distinguish known campaign visits without changing every link on the website into a tracking exercise.
In the inquiry record, preserve the observed source when known, the requested branch and the qualification outcome. Label an unknown source as unknown. A salesperson’s note, a tagged visit and a profile interaction can provide different pieces of evidence, but they should not be stitched into a certain attribution claim when the connection was not observed.
What should happen when the report shows a branch difference?
Translate the difference into a testable question, then inspect the relevant customer journey. Avoid prescribing more content or a listing change before identifying which stage appears to need attention.
If a branch receives search clicks but few useful inquiries, inspect the page’s audience fit, available service explanation and next action. If a public profile sends visitors to the wrong branch page, correct the mapping before judging the destination’s performance. If inquiries arrive but are poorly matched, review what the public information leads people to expect.
How can the monthly review stay focused?
Use a short decision record: observation, limitation, plausible explanation, proposed check, responsible team and review date. An illustrative observation could be that the share of suitable requests fell after a new service description went live. The next step is to review the actual requests and wording, not to claim the description caused the decline.
The San Francisco location-page guide helps evaluate content gaps. The San Jose branch-profile guide helps check mapping errors. When a branch is new, the launch workflow identifies the facts that should be reconciled before establishing its baseline.
At the next review, record the completed check and observed outcome. Keep an unresolved explanation unresolved. This makes the report a useful record of business decisions rather than a recurring collection of confident but untested interpretations.
What else should you ask when comparing local branch results?
Should the branch with more impressions always receive more attention?
No. Impressions describe search visibility within the source’s scope, not the value or suitability of every opportunity. Review the queries, intended customer action and relevant page before deciding where to work. A smaller branch journey may have a clear information gap that can be addressed, while a large visibility total may include broad or poorly matched searches.
Can average search position rank the branches against each other?
It should not be treated as a universal league table. The branches may appear for different query sets and different customer tasks. Keep the source definition and filters visible. If you compare positions, explain the matched query set and period rather than implying that one average describes every search a local customer might see.
How should a new branch be reported?
Show its actual operating period and the stage of its website and profile launch. Separate a partial period from established branches’ full periods unless you create a genuinely shared window. Early observations can identify broken destinations or misunderstood services, but they do not establish the new branch’s long-term search potential.
Are call-button clicks qualified leads?
No. A call-button interaction is a platform observation. It does not confirm a completed call, a suitable inquiry or a resulting engagement. Report it using the platform’s definition and keep confirmed business outcomes in a separate record. If the connection between the interaction and an inquiry is unknown, do not assume the two counts refer to the same people.
Can we compare branch results after a major page change?
Yes, but record the change date and the conditions around the comparison. Keep similar periods and note campaigns, operating interruptions or service differences. Before-and-after observations can guide investigation, but they do not isolate the effect of one edit. Verify the customer route and review actual inquiries alongside the traffic measures.
How many metrics should the report contain?
Include enough to support the decisions the team can actually make. Every metric should have a definition, a source and a useful question attached to it. Remove measures nobody can interpret or act on. Keep a more detailed source record available for investigation without making the main review so crowded that important differences disappear.

How C3i3 Can Help
C3i3 can help organize a branch reporting plan around the way your locations operate and the inquiries you want to receive. Bring the current page map, a sample report and your working definition of a qualified inquiry. We can identify where labels, source scopes or branch differences make the comparison difficult to interpret.
Our local SEO services connect website improvements with practical measurement. Contact C3i3 to discuss a clearer comparison and the first customer journey worth investigating.