









































In this article
Lead generation reports become confusing when the agency counts inquiries, sales counts opportunities and finance counts revenue without a shared record between them. A Bay Area business can connect those stages without pretending every sale has a perfectly observable digital origin. Begin with consistent definitions and an explicit view of what is missing.
Planning a project? Explore Bay Area web design and marketing support and lead generation services.
What should a local lead generation agency report?
The report should show delivered work, source activity, inquiries, quality review and the next action. Define every stage and identify which system owns it. A dashboard that combines platform conversions and CRM contacts without reconciliation can count one person several times.
Add a short interpretation: what changed, which evidence supports the conclusion and what remains unresolved. Reporting should help the business choose its next work. A large collection of channel charts is less useful when nobody can explain how the totals relate to the sales queue.
How do I compare the best lead generation agencies by results?
Ask each provider to explain the route from a request to an accepted sales action. Review the definitions and the time required from your staff. An agency’s case study may provide context, but your comparison should still reflect your own offer, sales cycle and available records.
Use the same cost and stage definitions across candidates or pilots. A provider reporting cost per form submission cannot be compared directly with one reporting cost per accepted inquiry. Normalize the measures before deciding which result is more valuable.
How should I deduplicate inquiries from several channels?
Agree a record-matching process appropriate to the data you legitimately collect. A person may submit a form and later call, or return through a different channel. Your system should preserve useful source context while distinguishing repeated interactions from separate prospects.
Assign a review owner for ambiguous matches and avoid collecting unnecessary personal information solely to make attribution more detailed. Document the rule and its limitations. A consistent, proportionate process is more useful than silently changing the deduplication method from month to month.
For the connected decision, read Local SEO Reporting: How Do You Compare San Francisco and San Jose Branch Performance?.
Why should I compare inquiry cohorts instead of only monthly totals?
A cohort groups inquiries by a defined starting period or campaign. Following that group through later sales stages helps distinguish acquisition timing from sales timing. Otherwise a sale from last quarter may be credited to this month’s new campaign simply because it closed now.
Use observation windows that fit the business. A technical B2B inquiry may remain open longer than a straightforward local service request. Report open opportunities and their stage separately. Do not mark them as won merely because a forecast assigns a probability.
How do I calculate useful quality and cost measures?
Acceptance rate is accepted inquiries divided by reviewed inquiries under the stated definition. Cost per accepted inquiry is the included acquisition cost divided by accepted inquiries. Specify whether the cost includes agency fees, media and other production so the number can be reproduced.
For example, $4,000 in included cost divided by 20 accepted inquiries is $200 per accepted inquiry. If five later become opportunities, that same cost is $800 per opportunity. These hypothetical calculations describe different stages; neither establishes profitability without considering outcomes and business economics.
What should I do when attribution is incomplete?
Keep known, inferred and unknown sources distinguishable. A prospect may mention a referral after researching online, while browser settings or consent choices limit tracking. Ask a useful source question when appropriate, but avoid rewriting uncertainty into a precise revenue claim.
C3i3 can help align the website inquiry journey, campaign records and reporting questions with the systems your team actually maintains. The objective is a report you can use responsibly: clear stages, reproducible calculations and a practical decision about the next work.
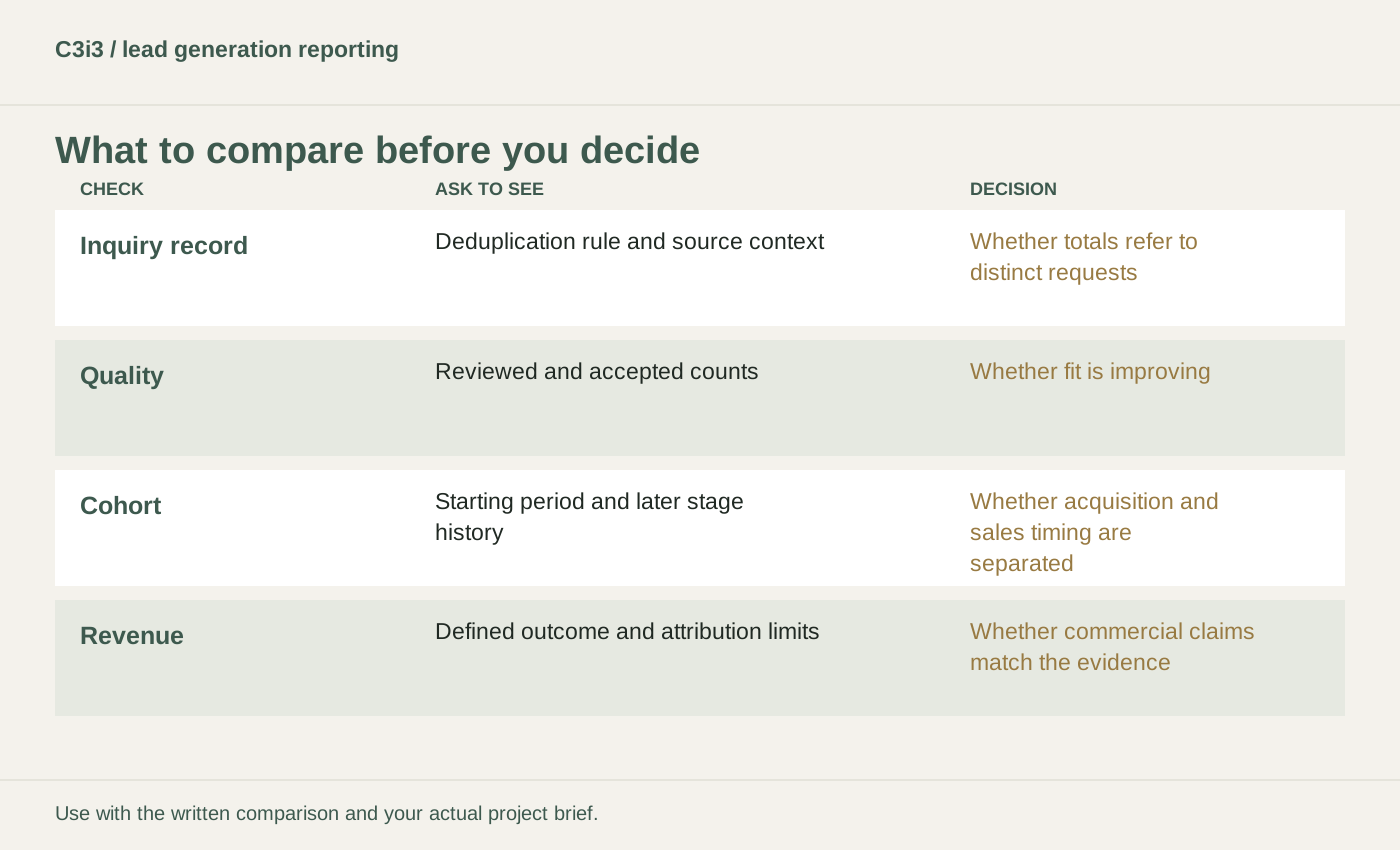
How do the key evaluation criteria compare?
| What to compare | Evidence to request | Decision it supports |
|---|---|---|
| Inquiry record | Deduplication rule and source context | Whether totals refer to distinct requests |
| Quality | Reviewed and accepted counts | Whether fit is improving |
| Cohort | Starting period and later stage history | Whether acquisition and sales timing are separated |
| Revenue | Defined outcome and attribution limits | Whether commercial claims match the evidence |
How could reporting change a campaign review?
Imagine a business seeing fewer inquiries this month but more accepted opportunities from last month’s cohort. A monthly-only dashboard suggests weaker performance, while the cohort view shows that the earlier requests are progressing through the sales process.
The team can review both acquisition and progression without forcing them into a single score. It still needs to understand current demand and later outcomes. The illustrative $200 and $800 calculations demonstrate stage-specific measures, not expected acquisition prices for Bay Area businesses.
What should you remember before the next step?
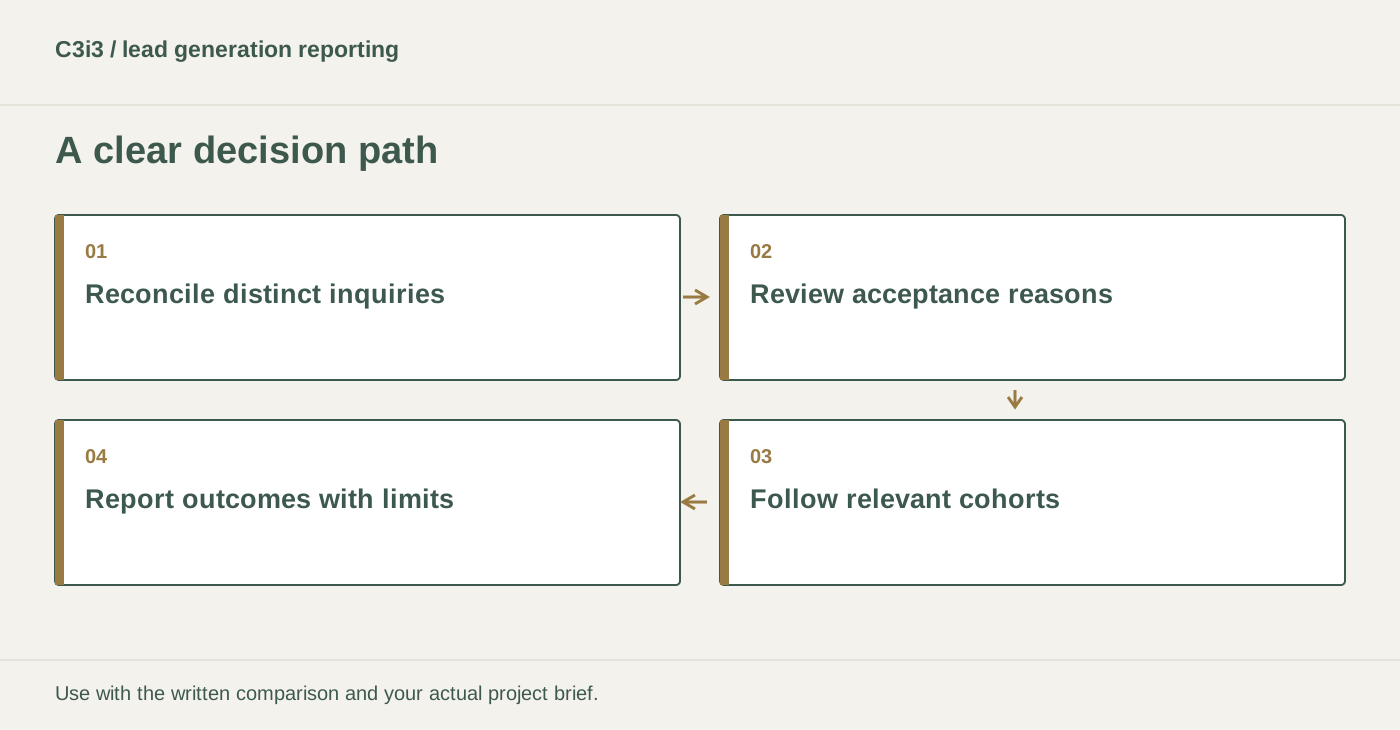
- Reconcile distinct inquiries.
- Review acceptance reasons.
- Follow relevant cohorts.
- Report outcomes with limits.
What else do local business buyers ask?
Can analytics prove every sale came from one channel?
No. Cross-channel research, referrals and tracking limits can leave incomplete attribution. Report the evidence and the uncertainty.
Should pipeline value be reported as revenue?
No. Keep open or estimated pipeline separate from realized business outcomes and label the definitions clearly.
What if sales does not update the CRM?
Reporting will have a limit. Agree a manageable update process and show missing stage information rather than treating it as a confirmed result.
Which sources can help you verify these decisions?
The frameworks and hypothetical examples are C3i3 editorial analysis. The linked primary sources provide platform, usability or disclosure context for the relevant decisions.
How can C3i3 help you plan the right next step?

Share your current website, the customers you want to reach and the work you want to improve. C3i3 brings design, content, technology and marketing into a coordinated project scope.
Review C3i3’s background, explore lead generation or tell us about your project.